Oil Prices Surge, Signaling Prolonged Conflict Ahead
The WTI crude oil chart is signaling a prolonged geopolitical conflict, breaking a two-year downtrend and trading above its key trend line. This indicator contrasts with fluctuating media narratives, suggesting market anticipation of a drawn-out struggle.

Oil Prices Surge, Signaling Prolonged Conflict Ahead
In a market often swayed by sensational headlines and shifting narratives, a single commodity chart is emerging as the most reliable indicator of the ongoing geopolitical conflict: West Texas Intermediate (WTI) crude oil. Recent price action suggests that despite optimistic pronouncements, the market anticipates a protracted struggle, a sentiment starkly contrasting with the fluctuating timelines presented in mainstream media.
Conflicting Timelines Emerge
The ambiguity surrounding the duration of the conflict has been a significant source of confusion for investors and the general public alike. Within a mere five-day period, conflicting statements from prominent figures have painted vastly different pictures. Initial claims of a swift victory in Iran were followed by projections of the conflict concluding within three to four days.
Later, a timeline of four to five weeks was issued, only to be superseded by the assertion that such wars could potentially be fought indefinitely. This rapid evolution of timelines highlights the inherent uncertainty and the challenges in discerning accurate information amidst a volatile geopolitical landscape.
The Chart as the Ultimate Arbiter
For seasoned investors, particularly those with two decades of market experience, the adage “follow the money” often holds true. In this context, the financial markets, specifically the price movements of oil, are seen as a more objective gauge of the situation than the often-clickbait-driven news cycle.
The WTI crude oil chart, a benchmark for global oil prices, has recently broken a two-year downtrend. This technical breakout, occurring just days before the initial escalation of hostilities, signals a significant shift in market sentiment.
Interpreting the Oil Trend
The current trading position of oil above its established long-term trend line is being interpreted by market analysts as a key indicator. The prevailing analysis suggests that if oil prices remain elevated and sustain their position above this trend line, it implies that the market anticipates a prolonged conflict. Conversely, a sustained drop below this critical level would signal to the market that de-escalation is imminent.
Market Sentiment vs. Media Narrative
As of the latest analysis, oil is trading above this crucial trend line. This technical posture directly contradicts the more optimistic headlines suggesting an imminent victory or resolution.
The market’s pricing suggests a more cautious outlook, implying that any celebrations of victory might be premature. This divergence highlights the importance of looking beyond immediate news reports and examining the underlying financial indicators that reflect the collective wisdom of market participants.
Navigating the Information Overload
In an era saturated with information from various sources, including social media opinions and traditional news outlets, discerning truth from noise can be a daunting task. The presenter’s advice to investors is to filter out the speculative commentary and focus on the tangible data presented by the oil chart. This approach leverages the market’s inherent mechanism of pricing in future expectations, providing what is described as the only truly honest signal available in the current environment.
Broader Market Implications
The implications of a prolonged conflict, as suggested by the oil chart, extend beyond the immediate geopolitical sphere. Sustained high oil prices can have significant ripple effects across the global economy. Inflationary pressures can intensify as energy costs impact transportation, manufacturing, and consumer goods.
Central banks may face difficult decisions regarding interest rate policies, balancing the need to curb inflation with the risk of stifling economic growth. Energy security concerns can resurface, prompting nations to reassess their energy strategies and diversify supply sources.
The Role of On-Chain Data (Conceptual)
While this analysis focuses on traditional commodity markets, in the broader cryptocurrency and blockchain space, similar principles apply. On-chain data, which tracks transactions and activity directly on a blockchain, can offer insights into the real-time sentiment and behavior of market participants. Metrics like transaction volumes, active addresses, and smart contract interactions can serve as digital charts, providing a transparent view of network health and user engagement, often unfiltered by traditional media narratives.
Conclusion
The WTI crude oil chart presents a compelling, data-driven perspective on the ongoing conflict, suggesting that market participants are bracing for a longer duration than some public statements might indicate. As investors navigate this complex period, paying attention to such fundamental market indicators, rather than solely relying on fluctuating news cycles, offers a more grounded approach to understanding the potential trajectory of both the conflict and its economic consequences.
Source: The Only Chart Telling the Truth About the War (YouTube)
Related Articles


Vegas Housing Market Flashes 2007 Warning Signs
Las Vegas's housing market is showing signs of a slowdown, with falling prices and historically low sales volumes. A sharp drop in tourism is impacting the local economy, contributing to reduced housing demand. While a repeat of the 2008 crash is not predicted, the market is in a correction phase.


Internet Blackout Tanks Putin’s Approval Ratings
New approval ratings show a significant drop for Vladimir Putin, tied to widespread internet disruptions in Russia. The data indicates public frustration over loss of online access is greater than concerns about the war in Ukraine. This digital blackout presents a unique challenge to the Kremlin.
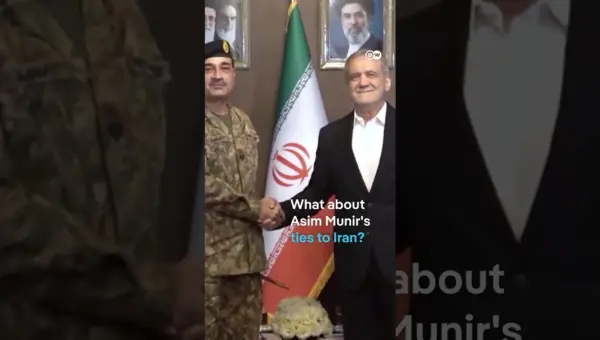
Pakistan Army Chief Acts as Trump’s Secret Diplomat
Pakistan's Army Chief, General Asim Munir, has become an unofficial diplomat, building a personal rapport with Donald Trump and mediating sensitive talks with Iran. This role highlights Pakistan's hybrid governance system, where the military plays a significant part in foreign policy. Munir's actions aim to stabilize the region and enhance Pakistan's global influence.