Rethink “Normal” Labs: Are You Healthier Than Your Numbers Say?
Lab results labeled "normal" may not reflect true health. This article explores why standard ranges can be misleading and highlights key tests like fasting insulin and specialized cholesterol panels that offer deeper insights into metabolic health and inflammation. Understanding these markers can help you achieve optimal well-being.

Rethink “Normal” Labs: Are You Healthier Than Your Numbers Say?
The phrase “your labs are normal” might sound reassuring, but it could be one of the most misleading statements in modern healthcare. What “normal” truly means is simply average within the current population, not necessarily disease-free or optimally healthy. In a time when many people face metabolic health issues, being average might mean you are also struggling, even if your test results appear within the standard range.
Many individuals report experiencing symptoms like weight problems, hair loss, and skin issues, yet receive the news that their blood work is normal. This can lead to dismissive responses like “it’s all in your head.” However, misinterpreting lab results can lead to incorrect diagnoses and hinder proper treatment. Understanding what your lab values truly indicate is crucial for taking control of your health.
Understanding Lab Reference Ranges
Lab reference ranges are often based on a bell curve, representing the typical results from a large group of people. To establish these ranges, the lowest and highest results are typically excluded. As the general population’s health declines, these “normal” ranges can become skewed, reflecting an average that is far from optimal.
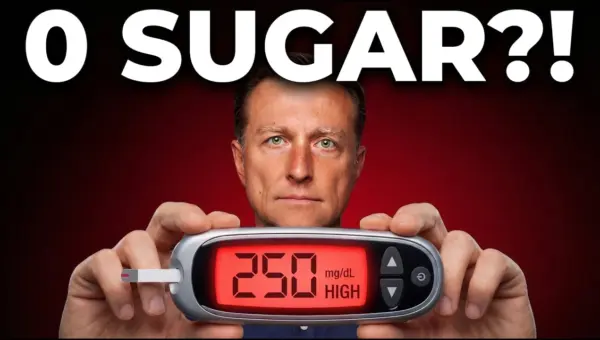
Shifting Standards: Glucose and Diabetes
Significant changes in diagnostic criteria highlight this issue. For instance, the normal fasting glucose level was lowered in 1997 from 140 mg/dL to 126 mg/dL. Overnight, this change reclassified 1.4 million people as diabetic. Similarly, the pre-diabetes threshold dropped from 110 mg/dL to 100 mg/dL in 2003, leading to 41 million new diagnoses. These shifts suggest that changes in numbers, rather than solely lifestyle, can redefine health statuses.
Cholesterol and Vitamin D: Redefined Norms
Similar adjustments have affected cholesterol and vitamin D levels. In the early 1980s, changes in cholesterol guidelines also led to millions being diagnosed with high cholesterol. For vitamin D, the recommended daily allowance (RDA) was set at 600 IU, based on preventing rickets and maintaining levels above 20 ng/mL. However, research suggests the actual daily need to maintain optimal levels is much higher, around 8,895 IU. A vitamin D level of 20 ng/mL is often considered a severe deficiency by many practitioners, yet it falls within some “normal” ranges.
The Blind Spot: Insulin Testing
One of the most significant oversights in standard blood tests is the infrequent measurement of fasting insulin levels. While fasting glucose is commonly checked, it doesn’t reveal the full picture of blood sugar regulation. High insulin levels, often present 15-20 years before glucose levels rise, indicate that the pancreas is working overtime to manage blood sugar.
Insulin is a hormone produced by the pancreas that helps move sugar from the blood into cells. In an average person, there’s only about one teaspoon of sugar in the entire bloodstream. Consuming a typical Western diet, which can contain 50-100 teaspoons of sugar daily, puts immense pressure on the body. Normal glucose readings can mask underlying insulin resistance, where cells become less responsive to insulin’s signal, forcing the pancreas to produce more.
Fasting Insulin Levels: What to Aim For
While there isn’t a universally agreed-upon normal range for fasting insulin, many experts suggest aiming for levels between 2-6 µU/mL. Levels at 8 µU/mL should raise concern, and those between 10-12 µU/mL indicate a high risk for insulin resistance, pre-diabetes, and eventually type 2 diabetes. Some clinicians may consider levels up to 12 µU/mL normal, but this can be a critical warning sign.
HOMIR Score: A Deeper Look at Insulin Resistance
The HOMIR (Homeostatic Model Assessment of Insulin Resistance) score is a calculation that uses both fasting insulin and fasting glucose levels to provide a more comprehensive assessment of insulin resistance. This score helps identify how effectively glucose and insulin are working together.
Over time, constant high carbohydrate intake can lead to insulin resistance. The body tries to compensate by producing more insulin, but eventually, the pancreas can become exhausted, leading to impaired glucose regulation. Testing fasting insulin or calculating a HOMIR score can help detect this process much earlier than relying solely on glucose tests.
A1C: A Three-Month Snapshot
The A1C test provides an average of blood sugar levels over the past two to three months. It reflects how much glucose has attached to red blood cells. While useful for tracking long-term trends, the A1C can be influenced by weekend eating habits or periods of poor dietary choices, potentially masking daily fluctuations.
The Dawn Phenomenon
Some individuals experience elevated blood sugar levels in the morning, known as the dawn phenomenon. This can occur due to high cortisol levels, which mobilize sugar, or the liver producing excess glucose, especially in those with insulin resistance. Even without consuming carbohydrates, the liver can convert other substances into sugar, leading to higher morning readings.
For those experiencing this, reducing carbohydrate intake and practicing intermittent fasting can help improve insulin sensitivity and normalize morning blood sugar levels. Incorporating morning walks can also help burn off excess sugar.
Minerals, Vitamins, and Inflammation Markers
Standard blood tests may not accurately reflect levels of essential minerals like potassium, magnesium, selenium, and zinc, as they are often stored within tissues rather than circulating freely in the blood. Specialized tests might be needed for a more accurate assessment.
Similarly, while B12 is commonly tested, the results may not distinguish between active and inactive forms. Tests like the MMA (methylmalonic acid) test or homocysteine can offer a clearer picture of B12 status.
C-Reactive Protein (CRP): An Inflammation Indicator
C-reactive protein (CRP) is a marker for inflammation. Ideally, CRP levels should be close to zero, with levels below 1 mg/L considered optimal. While some doctors may deem levels below 3 mg/L acceptable, even slightly elevated CRP can indicate a low-grade inflammatory state. Reducing inflammation can be achieved through diet (avoiding seed oils, sugar, refined carbs), improving sleep, managing visceral fat, and incorporating omega-3 fatty acids.
Cholesterol: Beyond the Basics
Cholesterol is essential for bodily functions and is produced by the liver. High cholesterol levels, particularly on a low-carbohydrate diet where fat intake increases, do not automatically equate to disease. The type of LDL (low-density lipoprotein) particles is more important than the total LDL count.
There are two main types of LDL: Pattern A (large, buoyant particles) and Pattern B (small, dense particles). Pattern A is generally considered less harmful and is often seen in individuals on low-carb diets. Pattern B particles are smaller and denser, more easily penetrating artery walls, and are associated with inflammation and heart disease risk. A specialized lipid profile can differentiate between these patterns, providing more insight than a standard cholesterol test.
Cortisol and Heart Rate Variability
Cortisol, a stress hormone, follows a daily rhythm. A single blood test may not capture the full picture. Saliva tests, taken at multiple times throughout the day, offer a more complete assessment. Alternatively, heart rate variability (HRV) tests, often available through wearable devices, can indirectly measure cortisol’s impact on the autonomic nervous system.
Vitamin D: Active vs. Inactive Forms
Standard vitamin D blood tests often measure inactive forms of the vitamin. Vitamin D resistance, where the body doesn’t effectively use vitamin D even with normal blood levels, is common. A high parathyroid hormone (PTH) level alongside normal vitamin D can suggest that vitamin D is not effectively reaching the cells. Optimal vitamin D levels are generally considered to be between 50-70 ng/mL, and potentially higher for therapeutic purposes.
Key Health Takeaways
- Don’t Rely Solely on “Normal” Ranges: Average lab results don’t always mean optimal health. Discuss your numbers and symptoms with your doctor.
- Consider Insulin Testing: Fasting insulin and HOMIR scores can detect insulin resistance years before blood glucose levels become abnormal.
- Understand Cholesterol Particles: Differentiate between large (Pattern A) and small (Pattern B) LDL particles for a better heart health assessment.
- Monitor Inflammation: Aim for a CRP level below 1 mg/L. Lifestyle changes and diet can significantly impact inflammation.
- Optimize Vitamin D: Aim for vitamin D levels between 50-70 ng/mL, and consider PTH levels as an indicator of vitamin D utilization.
- Consult Your Doctor: This information is for educational purposes and not a substitute for professional medical advice. Always discuss your health concerns and test results with a qualified healthcare provider.
Disclaimer: This article provides general health information and is not intended as medical advice. Always consult with a qualified healthcare professional for any health concerns or before making any decisions related to your health or treatment.
Source: So Called "Normal Labs" are NOT Healthy (YouTube)
Related Articles


Bread’s Hidden Sugar Spike: Why It’s Not Gluten That’s the Culprit
Discover why the starch in bread, not gluten, may be the real culprit behind blood sugar spikes and other health concerns for the majority of people. Learn how to make informed choices about your diet.


Boost Your Health: Daily Eggs Improve Skin, Brain, and More
Discover how eating four eggs daily can enhance your skin's radiance, sharpen your focus by reducing brain fog, and improve hormone balance and vision. This simple dietary habit leverages the power of nutrients like choline, lutein, and zeaxanthin for comprehensive health benefits.

Your Liver Is Making Too Much Sugar: Here’s Why
Discover why your liver might be producing excess sugar, even if you avoid sweets. Learn about insulin resistance, cortisol, and actionable steps to manage your blood sugar levels.